
Full factorial experiment design using MNIST handwriting dataset
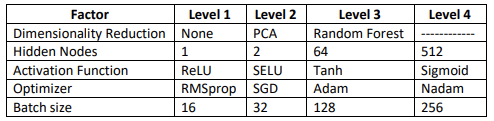
The purpose of this study was to closely examine the influence of hyperparameters on single-layer neural networks with one, two, 64, and 512 nodes to gain an intuition for right-sizing a NN to a problem space.
Check out my repo here
Findings
Beginning with the end. If interested in more details, please review the supporting plots, commentary, and paper below.
The advice to start with simple models and increase complexity is sound. For simple neural networks, the number of weight parameters (nodes) has the largest influence on the predictive power of the model. However, if constrained by computing resources (i.e. ML at the edge) very small models can produce enough predictive power to be useful in some contexts.
With 784 input features (28×28 greyscale), models did not have enough variance to perform extremely well at discriminating classes until 512 nodes were used – scoring 98.3% test accuracy with an Fbeta score of 98.2%.
Surprisingly, with only a single node models performed three or four times better than random chance (10%) on the test dataset – 38% accuracy and 27% Fbeta. Models with two nodes doubled these results with 71% accuracy and 62% Fbeta.
The use of dimensionality reduction techniques like PCA and Random Forest to map the input to a higher dimensional space to reduce model complexity was the second most influential factor followed by the activation function of the nodes. These factors had mixed results where some levels outperformed others.
My takeaway from this exercise was very simple models can be surprisingly good – maybe even good enough to productionalize depending on the performance needs of the business context. Dimensionality reduction is worth experimenting with to learn if it will provide a performance boost. Finally, there is evidence suggesting to follow the crowd in adopting the more contemporary activation functions like ReLU and SELU with better gradient properties than sigmoid.
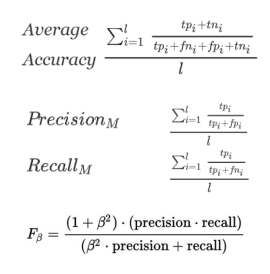
Performance metrics
Accuracy and Fbeta (labeled as F1 in plots)
Plots
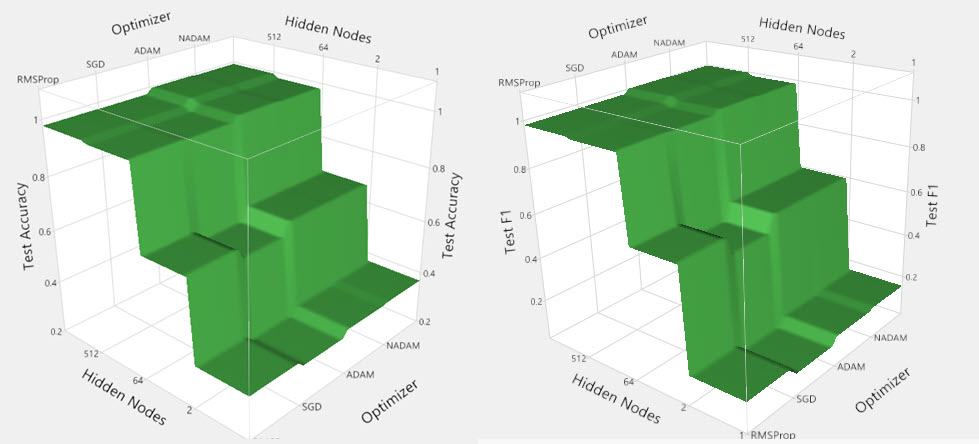
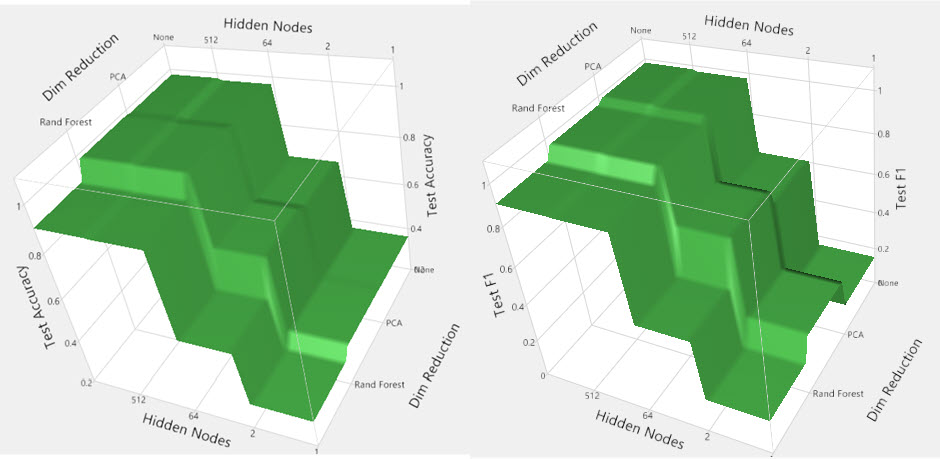
Surface plots
Top plots indicate that ADAM optimizers (ADAM and NADAM) with 512 nodes result in the highest performance on unseen test data – both accuracy and Fbeta.
Bottom plots highlight a key difference – Fbeta is highest when no dimensionality reduction techniques were used. Depending on the importance of incorrect predictions, this information will drive a modeling decision.
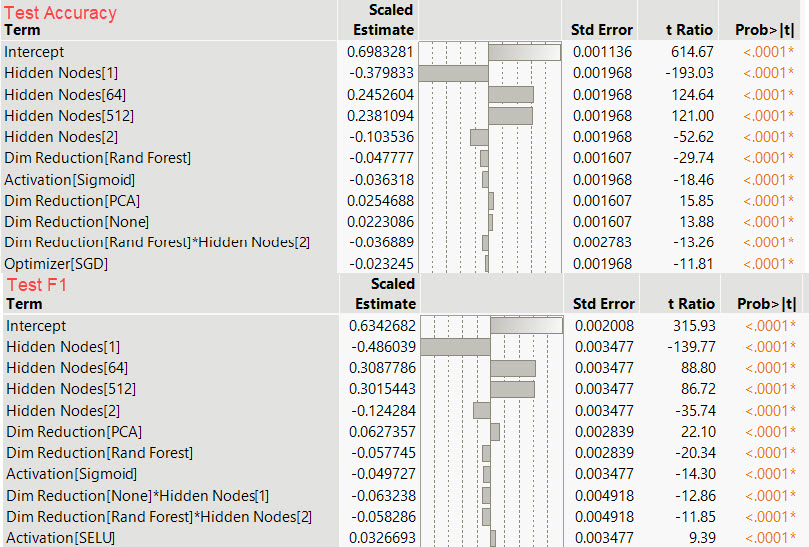
Coefficient summary
We see the contribution (coefficient) of each level to either test accuracy or Fbeta score. Following the surface plots above, the number of nodes produced the greatest effect followed closely by dimensionality reduction.
The final column (Prob>|t|) indicates the findings from the surface plots are statistically significant.
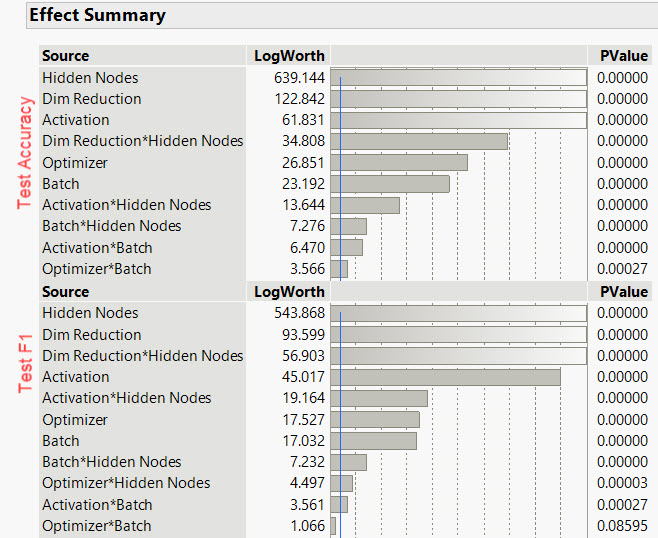
Effect Summary
Main and interaction effects of each factor are ranked by their impact on test accuracy or test Fbeta. We see further agreement with the proceeding plots that the factors identified have a statistically significant influence on test accuracy or Fbeta.
Interestingly we see the Dim Reduction*Hidden Node interaction explored in the bottom surface plot in the Surface Plot section above.